![](https://cdn.myportfolio.com/aac24a27-2355-46d8-a1e6-0ba01899d1c6/abcc6166-6606-47da-9d36-9c5492e262e1_rw_1920.png?h=8f53d5a3029139227fdac56b632a8b95)
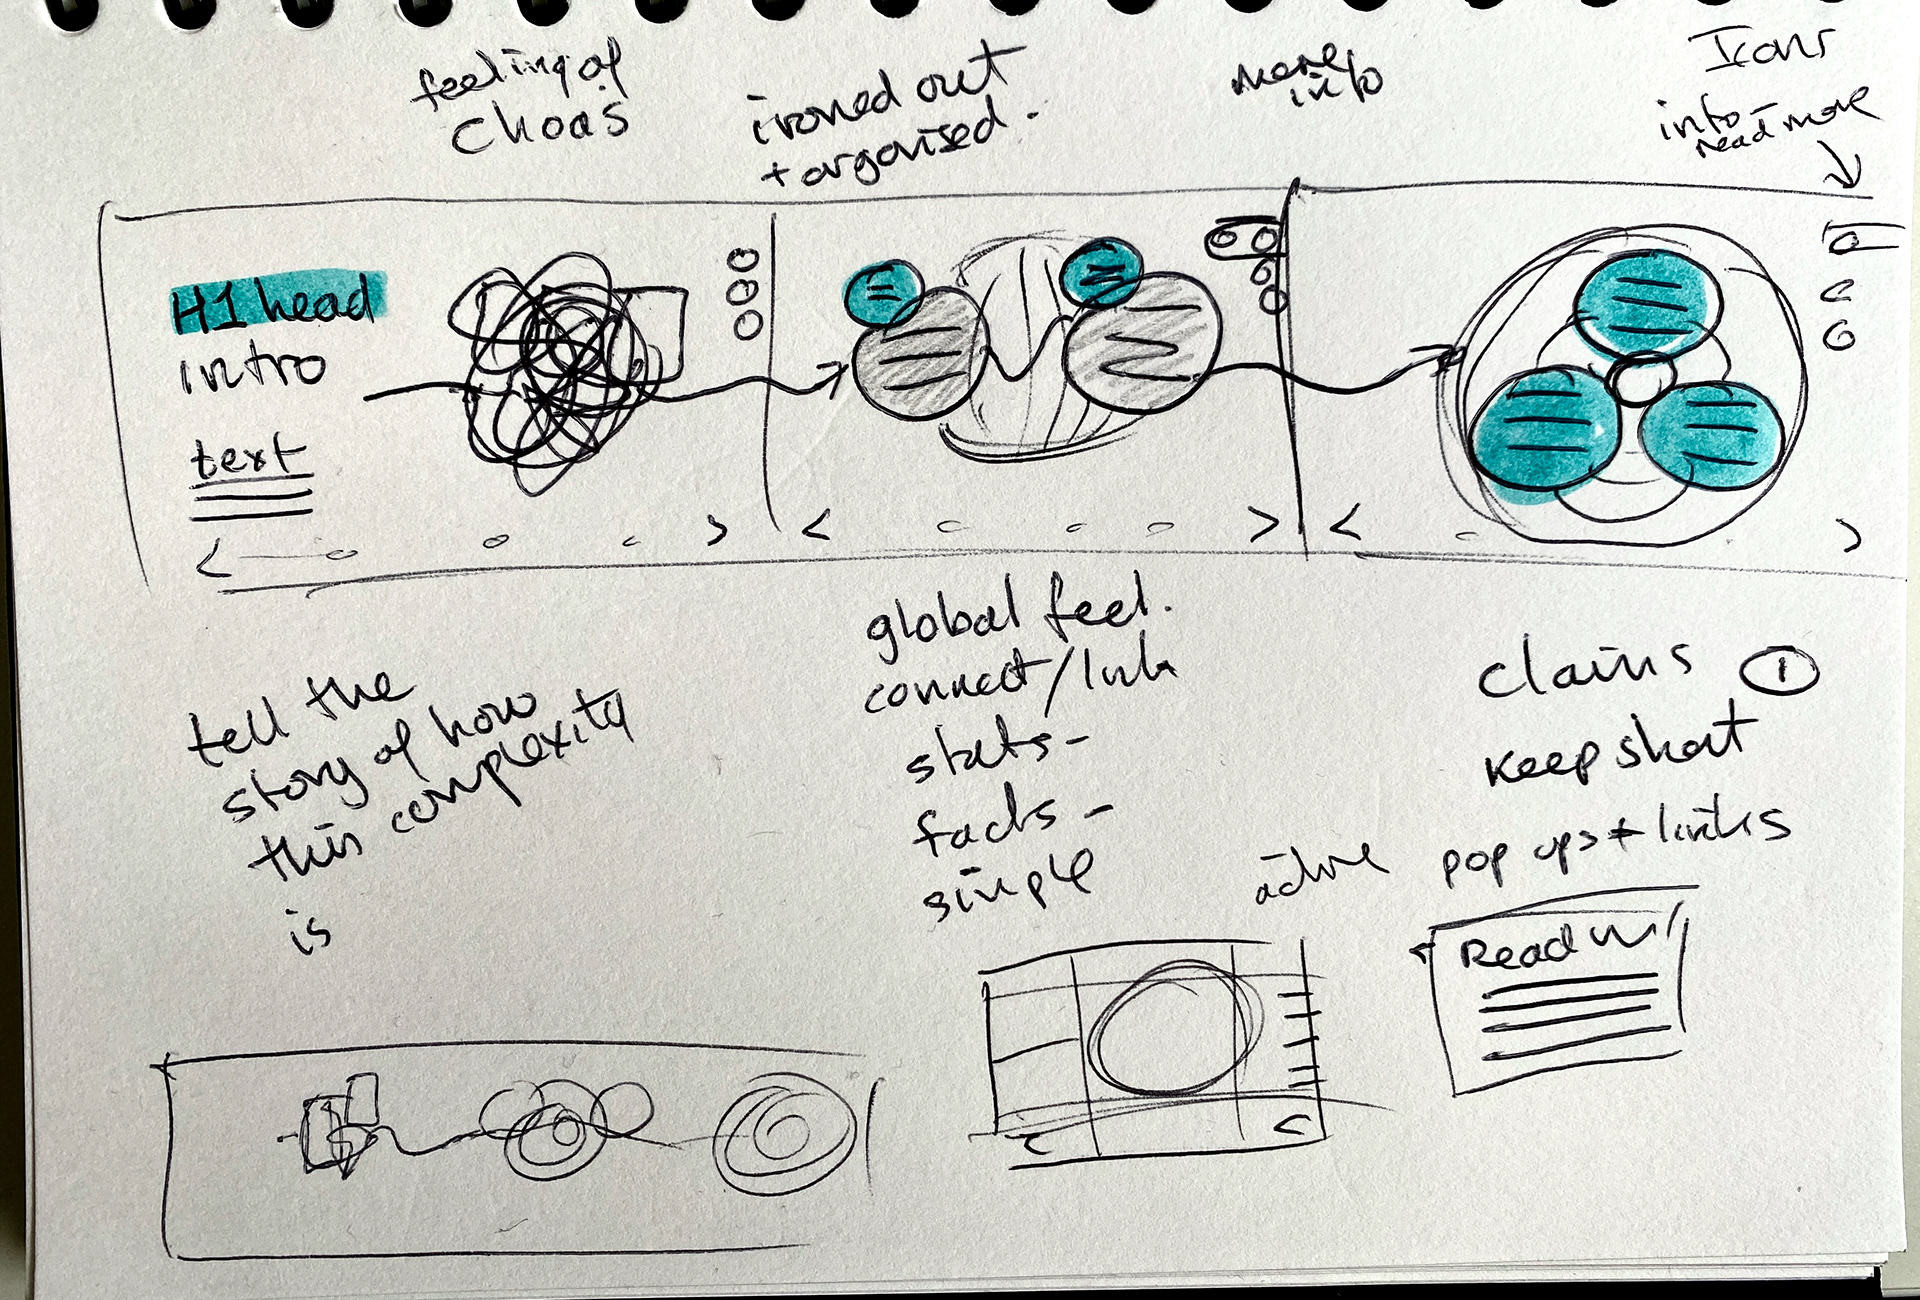
Analysing complex data
Translating data in paper sketch form to plan ideas and options
Sketches and thinking processes demonstrated for creating a clear set of visuals.
![](https://cdn.myportfolio.com/aac24a27-2355-46d8-a1e6-0ba01899d1c6/9f530953-cda4-4d5b-8a9c-16c1c87533c5_rw_1920.png?h=c49ff19a3383eae3f0347ff05f7332ba)
![](https://cdn.myportfolio.com/aac24a27-2355-46d8-a1e6-0ba01899d1c6/b39401b5-12a1-4e51-8b64-cd2aa0d0efa3_rw_1920.jpg?h=c640c0713f271050b0b51837e465d529)
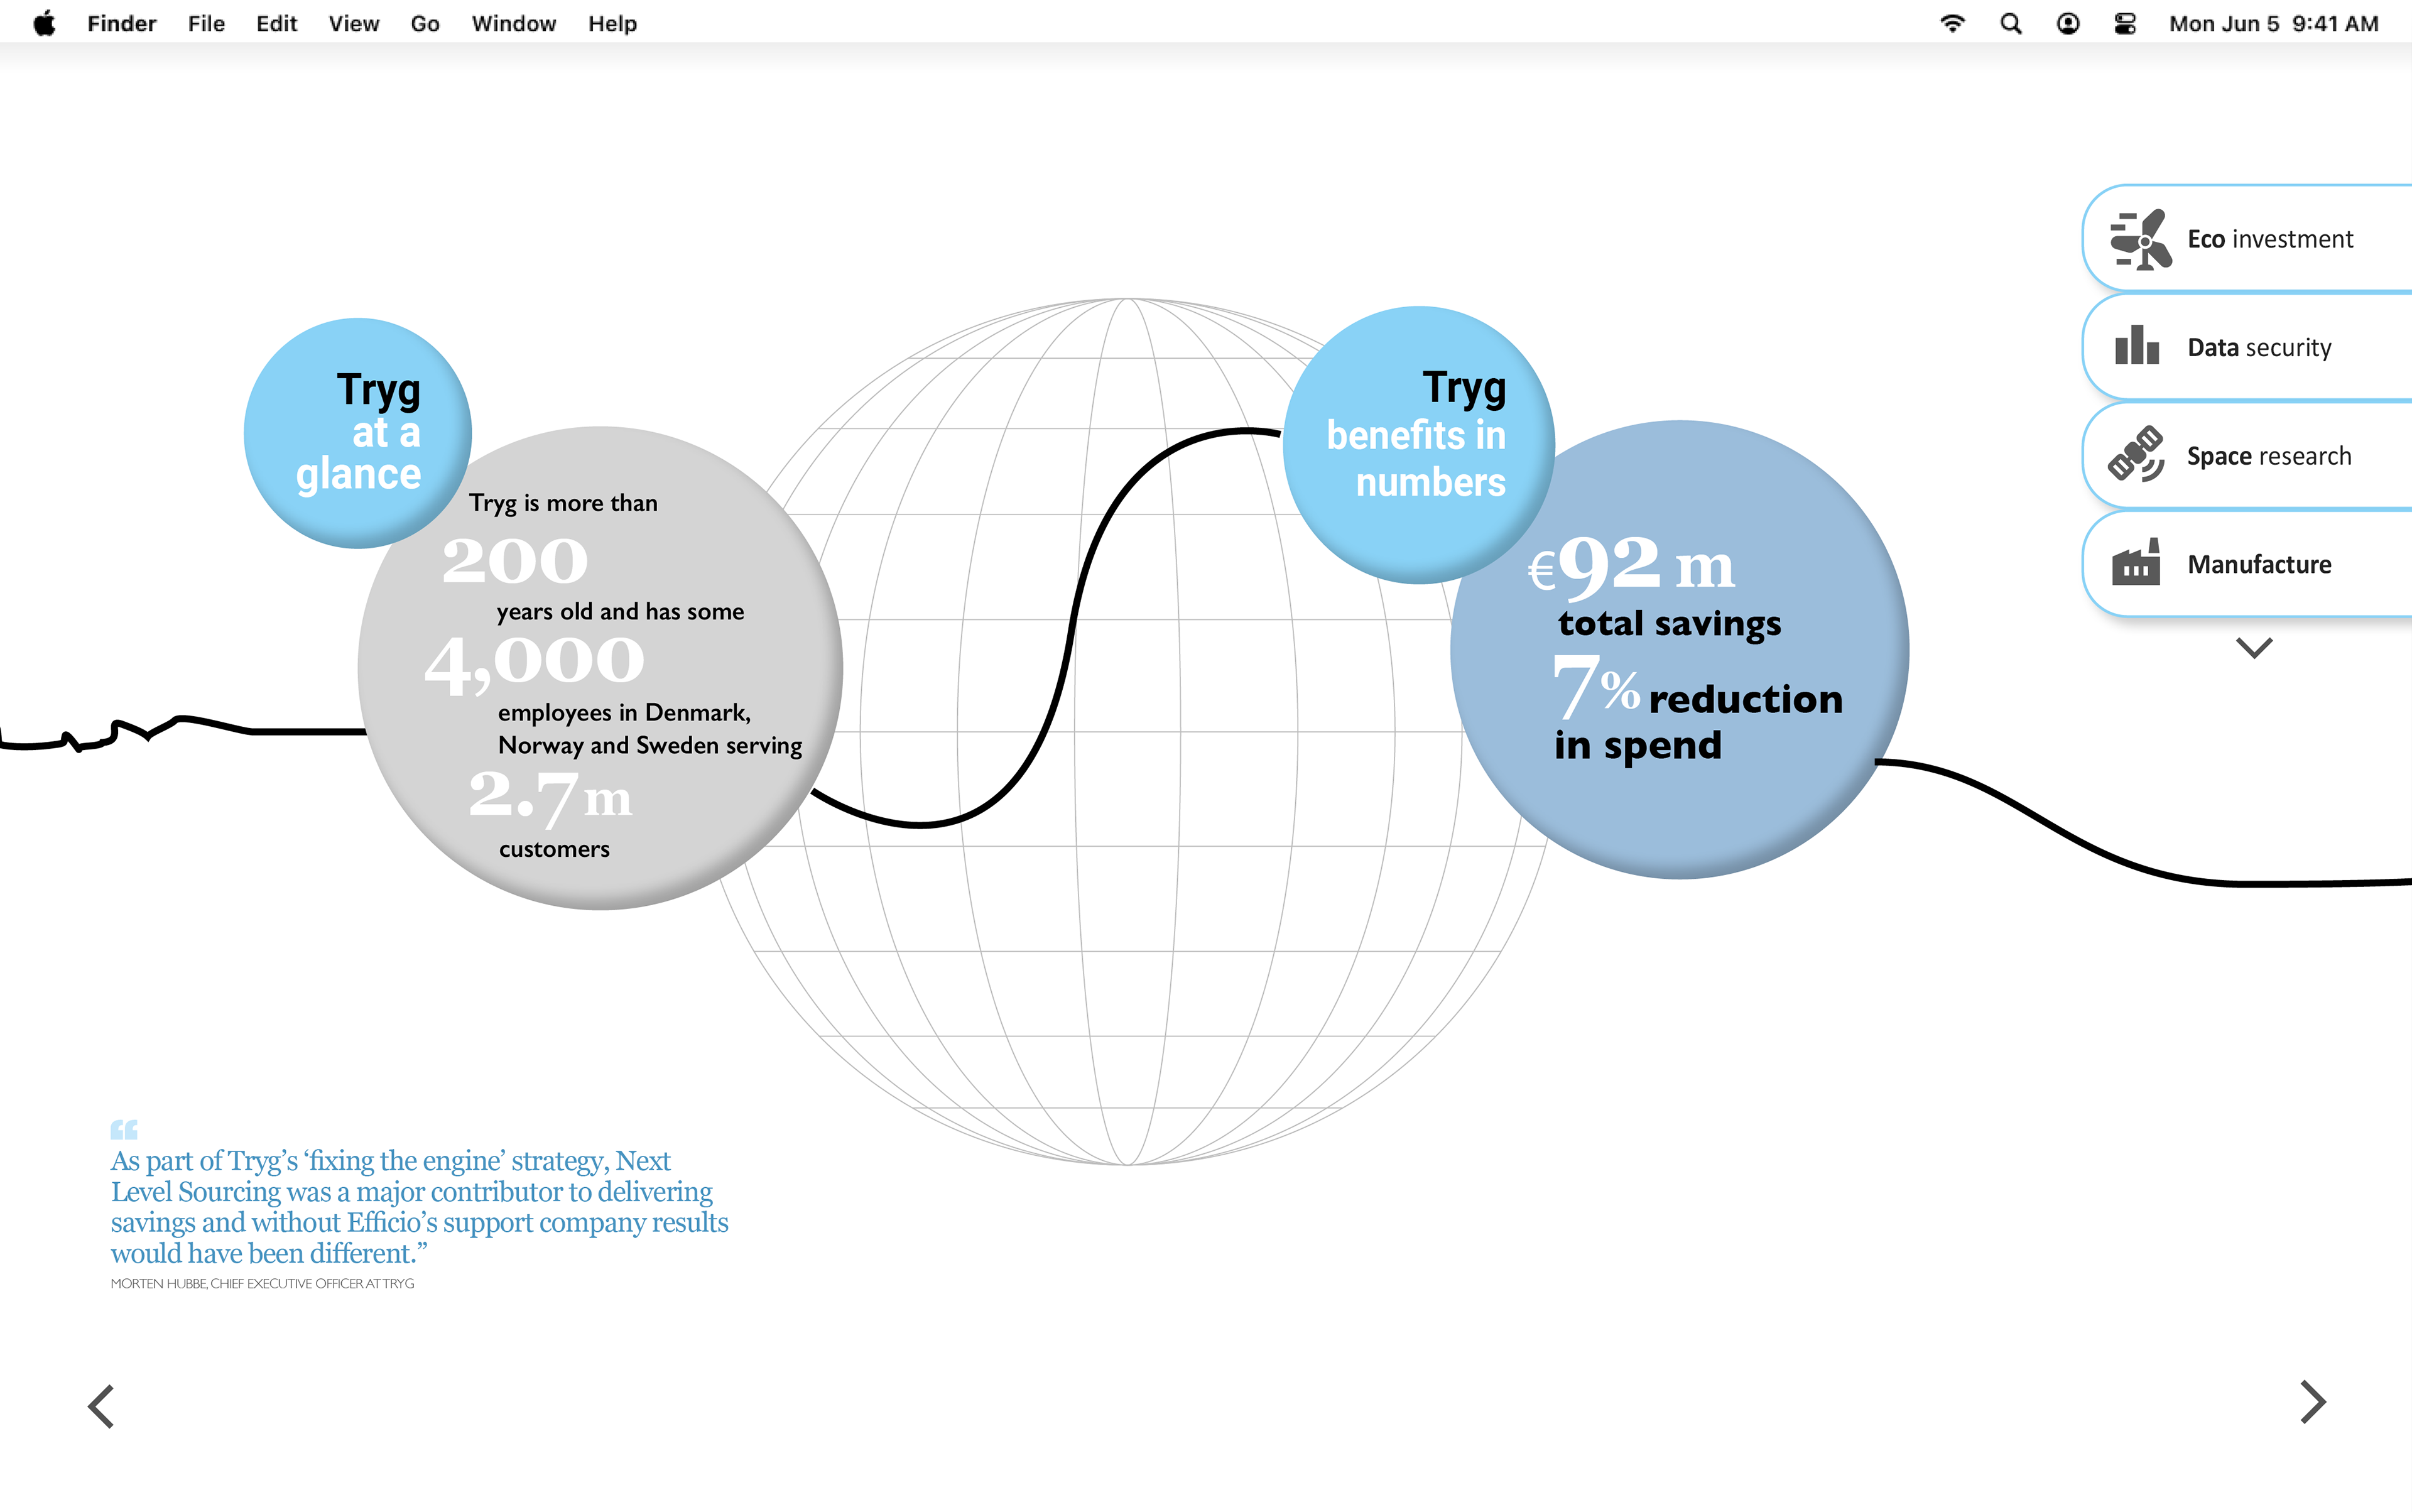
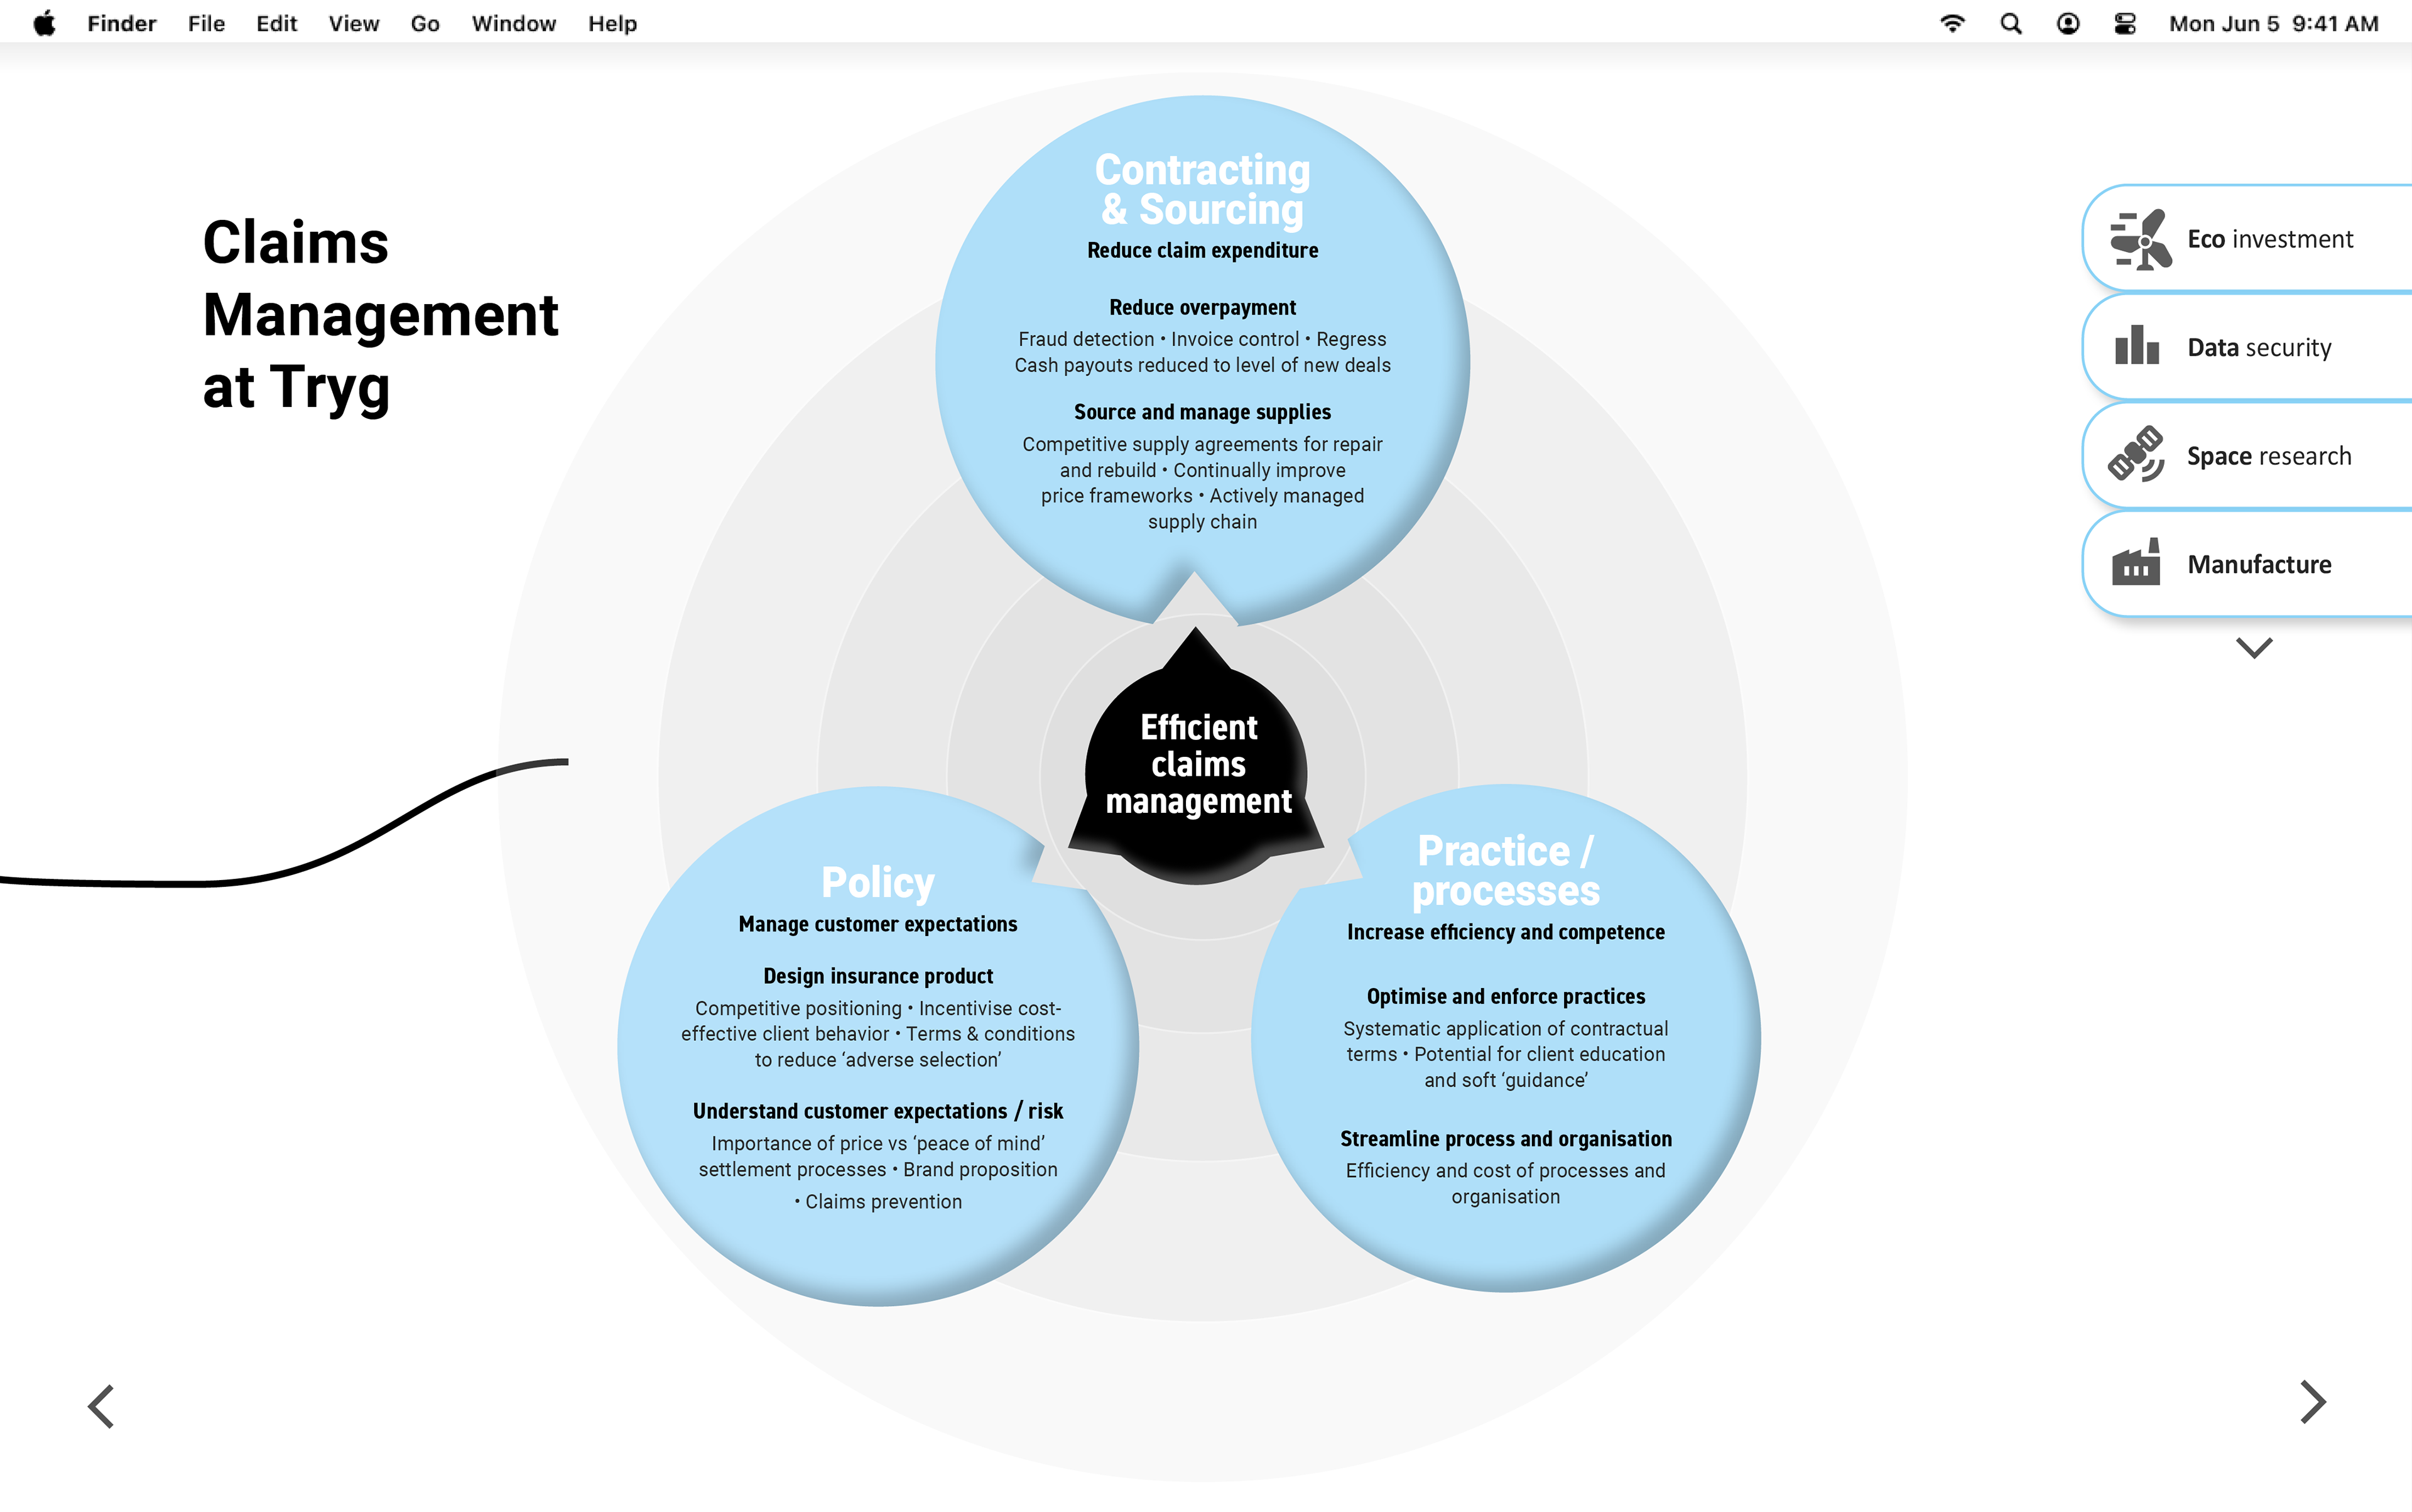
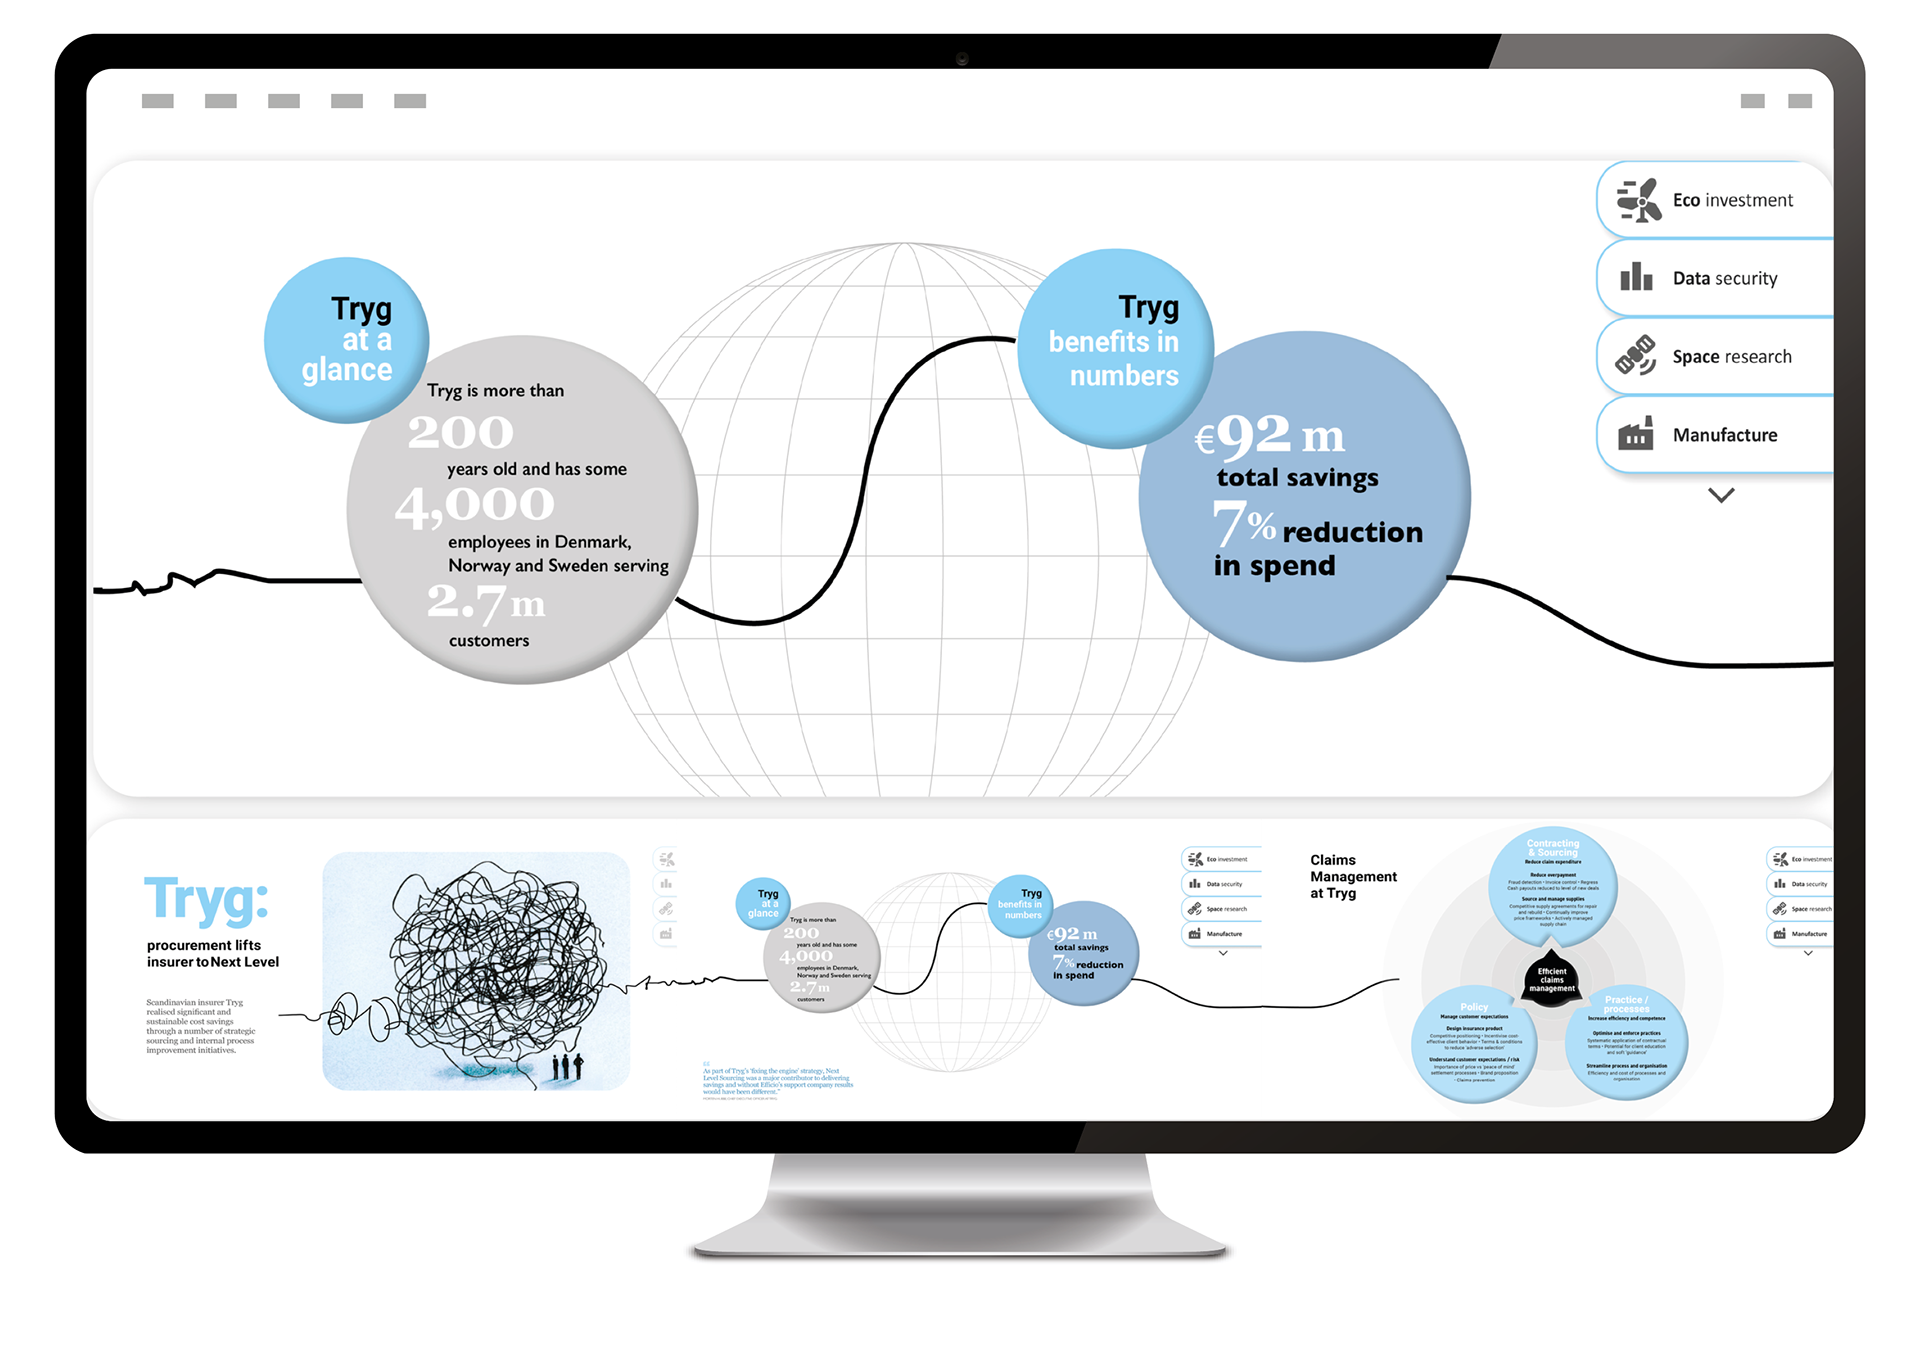
Linking the information journey
Designed to be a continual line, taking the user through the process
I analysed complex data and transformed it into clear visual infographics for a Danish procurement company. The data underwent refinement and simplification to enable a visual solution where I linked the visuals from screen to screen with the line effect representing the initial problem and Tryg solving this, untangling data to a smooth solution.
![](https://cdn.myportfolio.com/aac24a27-2355-46d8-a1e6-0ba01899d1c6/88e3a333-0760-4eb4-abf0-db45381e1240_rw_3840.png?h=d8ae67482775eba44c54ccc1317744c0)
![](https://cdn.myportfolio.com/aac24a27-2355-46d8-a1e6-0ba01899d1c6/7c3492b1-adb9-4dbe-a588-15b3c2282e4c_rw_3840.png?h=938b980f582b80f736297285240f7a23)
![](https://cdn.myportfolio.com/aac24a27-2355-46d8-a1e6-0ba01899d1c6/a75d54ba-1039-46d6-aed5-5797804ab6f0_rw_3840.png?h=62e6c09d7b04605bca3c89a0f882600a)