Situation
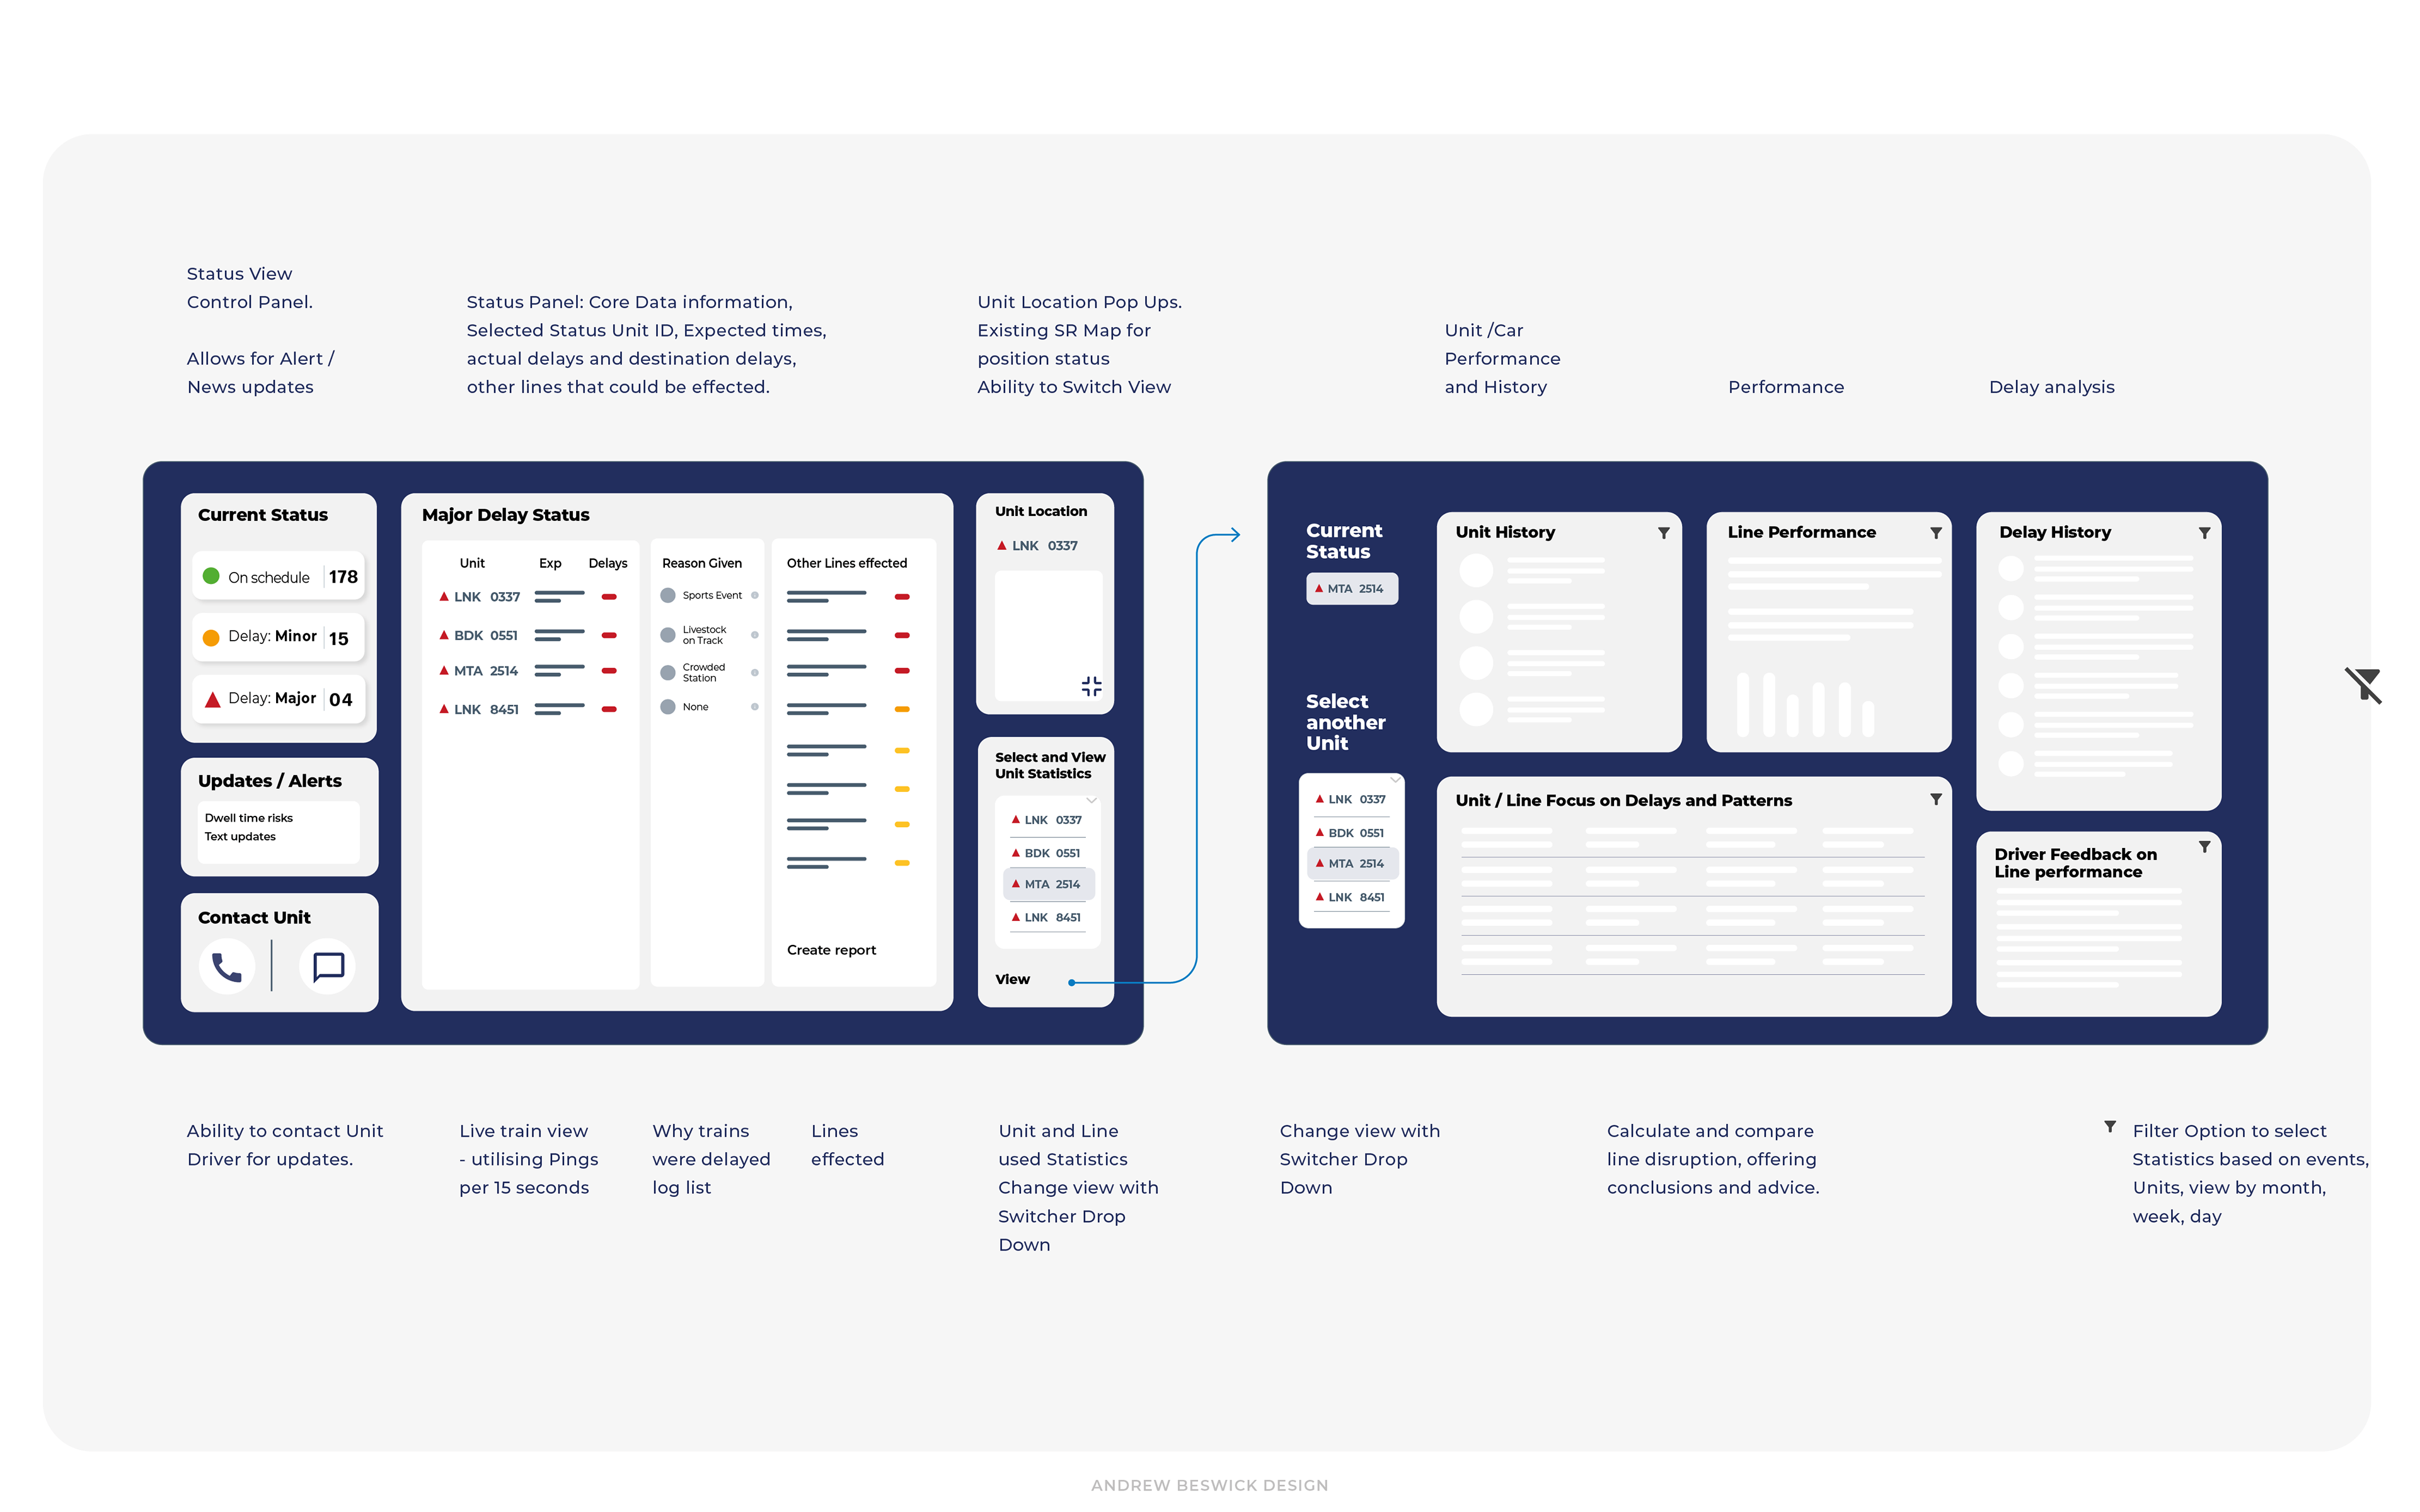
Large volumes of data were being turned into disconnected charts—hard to follow, no clear story.
Task
Work with analysts, BAs, and the client to design a UX that made the data clear, accessible, and easy to use.
Action
Created a simplified way to visualise complex data—giving performance teams across the country an intuitive interface to select, view, and understand key metrics and feedback quickly.